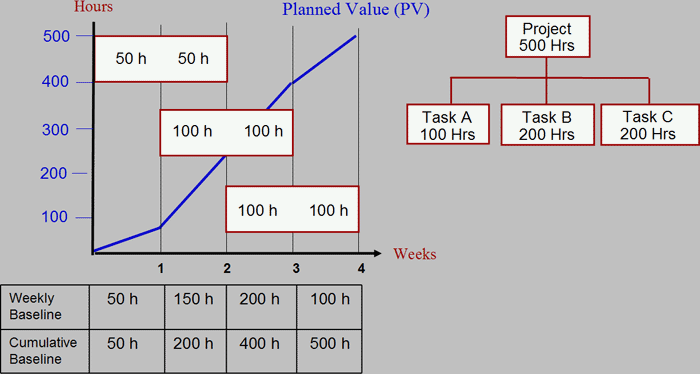
Building
the Baseline: Step 3 – Add the hours to the bottom in
each time period and plot the cumulative baseline

The table shows the weekly and cumulative cost baseline in labor
hours. The graph shows the Gantt chart with the cumulative cost
baseline superimposed. The cumulative cost baseline is also known
as the planned value. |

