PERT
and CPM Analysis – some important formulas
| Expected Task Duration: |
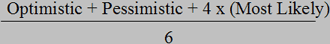 |
| Standard Deviation from Expected Task Duration: |
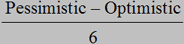 |
68% of the Time
a Task Will Take: |
 |
Expected
Duration
for a Project: |
 |
| Standard Deviation of Expected Project Duration: |
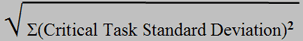 |
68%
of the Time
a Project Will Take: |
 |
|